Insights into data
How to Interpret Box Plots
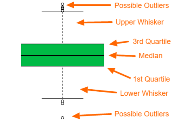
A box plot gives us a visual representation of the quartiles within numeric data. The box plot shows the median (second quartile), first and third quartile, minimum, and maximum. The main components of the box plot are the interquartile range (IRQ) and whiskers. (more…)
Justin Nafe December 26th, 2016
Posted In: Visualizations
Graph Website Links With Neo4j
There are many tools to use to capture your site’s structure. ScreamingFrog SEO Crawler is a vital tool for SEOs and is extremely easy to get setup and export data. It can help you find broken links, review title and meta descriptions, evaluate redirects, etc… All and all, a useful tool to evaluate a site from an SEO perspective.
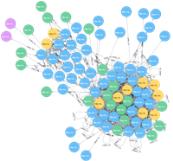
However, viewing the site as a graph can give you a visualization of your site’s structure, and if the visualization of your site’s structure doesn’t match up with what you thought it would be, then you could dig deeper.
For this post, I wanted to get a visualization of a site’s internal link structure. I used ScreamingFrog SEO Crawler to get the links for a website and Neo4j to graph the internal links. (more…)
Justin Nafe May 15th, 2016
Posted In: Visualizations
Tags: graphs