Insights into data
Facebook Stock Price after Quarterly Report
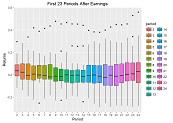
Last week, Wednesday after the close, Facebook reported a stellar quarter, beating analysts’ expectations by at least 10%, yet the stock price is falling after the initial surge. Is this the normal behavior for this stock?
We will take a closer look by reviewing the plans and strategies described in the latest conference call and performing some basic stats on the price after the report.
Justin Nafe July 31st, 2016
Posted In: Exploratory Analysis
Plot a Stock’s SMA Crossover Events
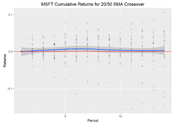
When investing in stocks, I often use technical indicators (along with fundamental homework) to figure out what stocks to buy and when. I understand how a stock is supposed to behave after a technical event happens and can get a good idea of how it did behave by using charts such as on Google Finance or Yahoo Finance and plotting the technicals, but what does it look like if I compile the events into one chart and see how the stock performs after the event as a whole?
Justin Nafe June 23rd, 2016
Posted In: Exploratory Analysis
Tags: r, stocks, technical events