Insights into data
Data Science Process
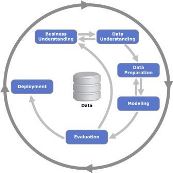
When working with data science on a regular basis within an organization, or for multiple organizations, a data science process is essential for creating quality analysis, insights, and models in an efficient manner.
The idea of having a standardized process for Data Science in particular is a somewhat new idea. For example, data science is often a team or individual who gathers data, processes the data, and generates a report for the business, often times different than the last report. This inconsistency makes it difficult to manage existing solutions and difficult for other team members to fill in. (more…)
Justin Nafe December 27th, 2016
Posted In: Machine Learning
Tags: data science
How to Interpret Box Plots
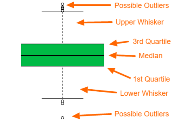
A box plot gives us a visual representation of the quartiles within numeric data. The box plot shows the median (second quartile), first and third quartile, minimum, and maximum. The main components of the box plot are the interquartile range (IRQ) and whiskers. (more…)
Justin Nafe December 26th, 2016
Posted In: Visualizations
Data Exploratory Analysis – Student Alcohol Consumption
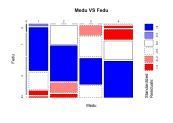
Most of us experimented with drinking to some degree while in school. With the Student Alcohol Consumption data set from UCI Machine Learning Archive (Fabio Pagnotta 2016), we thought it would be interesting to see what features are important to determine if the student is a heavy drinker or not. With the Student Alcohol Consumption data set, we predict high or low alcohol consumption of students. (more…)
Justin Nafe December 21st, 2016
Posted In: Exploratory Analysis
Tags: r
Facebook Stock Price after Quarterly Report
Last week, Wednesday after the close, Facebook reported a stellar quarter, beating analysts’ expectations by at least 10%, yet the stock price is falling after the initial surge. Is this the normal behavior for this stock?
We will take a closer look by reviewing the plans and strategies described in the latest conference call and performing some basic stats on the price after the report.
Justin Nafe July 31st, 2016
Posted In: Exploratory Analysis
Forecast Stock Prices Example with r and STL
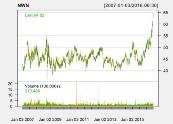
Given a time series set of data with numerical values, we often immediately lean towards using forecasting to predict the future.
In this forecasting example, we will look at how to interpret the results from a forecast model and make modifications as needed. The forecast model we will use is stl().
Natural gas companies usually display a seasonal component, so we will evaluate the adjusted closing price of Northwest Natural Gas Co (NWN) from 1/1/2007 to 6/30/2016.
Justin Nafe July 8th, 2016
Posted In: Exploratory Analysis
Plot Returns after Percent Drop in Price
With the Brexit upon us and the United Kingdom voting to leave the European Union, how will the domestic stock market behave? Some people believe that the market will take a hit.
If the market takes a dip, I want to be somewhat ready to take advantage of the buying opportunity.
My theory is that domestic stocks or ETFs should not get effected too much, but if they do, I’d like to know how they may behave after taking a 3% dip.
Justin Nafe June 24th, 2016
Posted In: Exploratory Analysis
Tags: technical events
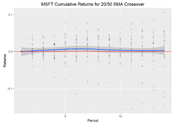
Plot a Stock’s SMA Crossover Events
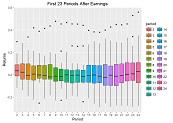
When investing in stocks, I often use technical indicators (along with fundamental homework) to figure out what stocks to buy and when. I understand how a stock is supposed to behave after a technical event happens and can get a good idea of how it did behave by using charts such as on Google Finance or Yahoo Finance and plotting the technicals, but what does it look like if I compile the events into one chart and see how the stock performs after the event as a whole?
Justin Nafe June 23rd, 2016
Posted In: Exploratory Analysis
Tags: r, stocks, technical events
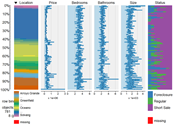
Impute Data with Related Features

Much of the data that we use for exploratory analysis is missing data. One way to handle the missing data is to impute it. We will use related data to impute crime locations.
What if we could determine the type of crime, forecast when a type of crime would happen again in a certain location or at a time of day, or what crimes are most predictable, or what features are most predictive of crimes? Maybe crime fighting could be improved, but this isn’t the first time people tried to address these issues. Simply googling forecast crime will render many interesting results.
Justin Nafe June 5th, 2016
Posted In: Exploratory Analysis
Tags: clustering, r
How to use linear regression to predict housing prices
So far, I’ve taken a few of machine learning classes, all from Coursera, and all of them started with predicting house prices with linear regression to get us started with machine learning.
For those of you that would like to get an in-depth look at Machine Learning, I would recommend the Machine Learning class taught by Andrew Ng. It is a very resource intensive class, resources being the time spent on the assignments and learning.
Justin Nafe May 30th, 2016
Posted In: Exploratory Analysis, Machine Learning
Tags: linear regression, r
Graph Website Links With Neo4j
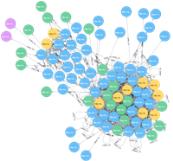
There are many tools to use to capture your site’s structure. ScreamingFrog SEO Crawler is a vital tool for SEOs and is extremely easy to get setup and export data. It can help you find broken links, review title and meta descriptions, evaluate redirects, etc… All and all, a useful tool to evaluate a site from an SEO perspective.
However, viewing the site as a graph can give you a visualization of your site’s structure, and if the visualization of your site’s structure doesn’t match up with what you thought it would be, then you could dig deeper.
For this post, I wanted to get a visualization of a site’s internal link structure. I used ScreamingFrog SEO Crawler to get the links for a website and Neo4j to graph the internal links. (more…)
Justin Nafe May 15th, 2016
Posted In: Visualizations
Tags: graphs