Insights into data
Data Exploratory Analysis – Student Alcohol Consumption
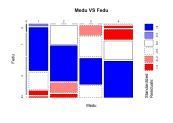
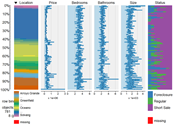
Most of us experimented with drinking to some degree while in school. With the Student Alcohol Consumption data set from UCI Machine Learning Archive (Fabio Pagnotta 2016), we thought it would be interesting to see what features are important to determine if the student is a heavy drinker or not. With the Student Alcohol Consumption data set, we predict high or low alcohol consumption of students. (more…)
Justin Nafe December 21st, 2016
Posted In: Exploratory Analysis
Tags: r
Facebook Stock Price after Quarterly Report
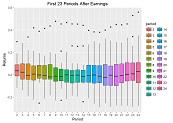
Last week, Wednesday after the close, Facebook reported a stellar quarter, beating analysts’ expectations by at least 10%, yet the stock price is falling after the initial surge. Is this the normal behavior for this stock?
We will take a closer look by reviewing the plans and strategies described in the latest conference call and performing some basic stats on the price after the report.
Justin Nafe July 31st, 2016
Posted In: Exploratory Analysis
Forecast Stock Prices Example with r and STL
Given a time series set of data with numerical values, we often immediately lean towards using forecasting to predict the future.
In this forecasting example, we will look at how to interpret the results from a forecast model and make modifications as needed. The forecast model we will use is stl().
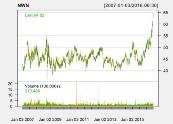
Natural gas companies usually display a seasonal component, so we will evaluate the adjusted closing price of Northwest Natural Gas Co (NWN) from 1/1/2007 to 6/30/2016.
Justin Nafe July 8th, 2016
Posted In: Exploratory Analysis
Plot a Stock’s SMA Crossover Events
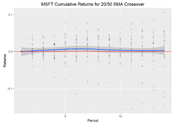
When investing in stocks, I often use technical indicators (along with fundamental homework) to figure out what stocks to buy and when. I understand how a stock is supposed to behave after a technical event happens and can get a good idea of how it did behave by using charts such as on Google Finance or Yahoo Finance and plotting the technicals, but what does it look like if I compile the events into one chart and see how the stock performs after the event as a whole?
Justin Nafe June 23rd, 2016
Posted In: Exploratory Analysis
Tags: r, stocks, technical events
Impute Data with Related Features

Much of the data that we use for exploratory analysis is missing data. One way to handle the missing data is to impute it. We will use related data to impute crime locations.
What if we could determine the type of crime, forecast when a type of crime would happen again in a certain location or at a time of day, or what crimes are most predictable, or what features are most predictive of crimes? Maybe crime fighting could be improved, but this isn’t the first time people tried to address these issues. Simply googling forecast crime will render many interesting results.
Justin Nafe June 5th, 2016
Posted In: Exploratory Analysis
Tags: clustering, r
How to use linear regression to predict housing prices
So far, I’ve taken a few of machine learning classes, all from Coursera, and all of them started with predicting house prices with linear regression to get us started with machine learning.
For those of you that would like to get an in-depth look at Machine Learning, I would recommend the Machine Learning class taught by Andrew Ng. It is a very resource intensive class, resources being the time spent on the assignments and learning.
Justin Nafe May 30th, 2016
Posted In: Exploratory Analysis, Machine Learning
Tags: linear regression, r
Next Word Exploratory Analysis
Introduction
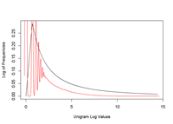
For this exploratory analysis, we will parse the en_US.blogs.txt text document, analyze the frequencies of different N-grams, and state how we will accomplish the goals of the Data Science Capstone project.
The data that we will use for this analysis can be found at heliohost.org, and was made available through the John Hopkins Data Science Capstone project.
Parse Text
The system will read the text and create a unigram, bigram, and trigram for our analysis. In the process of reading the text, the text is cleaned (remove punctuation except for the single quote, make all characters lowercase, remove unknown characters, remove numbers, and remove profanity).
Pseudo mapper and reducer functions are used to parse the cleaned data in case the resources on the computer are limited. The mapper simply creates the N-gram and the reducer sorts and computes the frequencies.
Justin Nafe July 20th, 2015
Posted In: Exploratory Analysis
Consumption Linear Regression Example
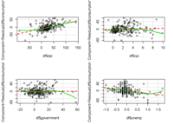
This example uses the USMacroG data provided with R to calculate consumption from changes within other variables.
Let us predict changes in consumption (real consumption expenditures) from changes in other variables such as dpi (real disposable personal income), cpi (consumer price index), and government (real government expenditures).
Justin Nafe January 17th, 2015
Posted In: Machine Learning
Tags: r