Insights into data
Plot a Stock’s SMA Crossover Events
When investing in stocks, I often use technical indicators (along with fundamental homework) to figure out what stocks to buy and when. I understand how a stock is supposed to behave after a technical event happens and can get a good idea of how it did behave by using charts such as on Google Finance or Yahoo Finance and plotting the technicals, but what does it look like if I compile the events into one chart and see how the stock performs after the event as a whole?
In this post, we will explore the 20 day Simple Moving Average (SMA) crossing above the 50 day SMA for Microsoft (MSFT).
At the start of this post, I ended up creating a number of functions that I thought would be a better fit in a package, TechnicalEvents, which is what we will use in this post. The package heavily uses quantmod and xts objects.
library(quantmod)
library(plyr)
library(ggplot2)
library(tidyr)
library(TechnicalEvents)
Stock Data
We use quantmod to get the stocks pricing information that we want, load them into an environment other than the global environment.
symbols <- c("MSFT", "AAPL", "CSCO", "IBM", "V", "YHOO", "FB")

#' Create a new environment to store the data
data.env <- new.env()

from.dat <- as.Date("01/01/07", format="%m/%d/%y")
to.dat <- as.Date("6/15/16", format="%m/%d/%y")

#' Get the stock quotes of all valid symbols. Skip over the invalid
#' symbols. Get a list of symbols that downloaded correctly.
sym.list <- llply(symbols, function(sym) try(getSymbols(sym, env = data.env, from = from.dat, to = to.dat)))
symbols <- symbols[symbols %in% ls(data.env)]
Plot SMA Crossover for a Stock
We will plot a compilation of crossover events for MSFT on the same chart so that we can see how the stock fairs after the event occurs. I use the cumulative returns to set the results on equal footing at the beginning.
Get the crossover events and the cumulative returns for each event:
win <- 14
slowSma <- 50
fastSma <- 20
sym.data <- get("MSFT", data.env)

events.buy <- GetSMACrossOverEvents(Ad(sym.data), fastSma, slowSma)
events <- index(events.buy[events.buy[,1] == TRUE])

event.rets <- lapply(events, function(x) GetWindowCumulativeReturns(Ad(sym.data), x, win))
For a 20/50 crossover, there are 26 buy events.
Put the data into n x m data.frame where n is the event and m is the return data for that event/observation.
adjs <- as.data.frame(matrix(unlist(event.rets), ncol = win, byrow=TRUE))
head(adjs)
## V1 V2 V3 V4 V5 V6
## 1 0 -0.001339170 -0.013391406 -0.004352218 0.00502172 0.004017384
## 2 0 -0.002786512 -0.011874266 -0.017816329 -0.02795278 -0.012573337
## 3 0 -0.009323352 -0.015939847 -0.019548939 -0.03157892 -0.019548939
## 4 0 -0.017625892 -0.009352445 0.017985617 -0.01115107 -0.003237390
## 5 0 0.001574820 0.012598367 0.047637811 0.07874013 -0.015354314
## 6 0 0.031263226 0.040980132 0.040980132 0.03717783 0.043092538
## V7 V8 V9 V10 V11
## 1 0.003347799 0.00000000 -0.01807837 -0.012721821 0.00669564
## 2 -0.012223801 -0.01886494 -0.01362199 -0.010825702 0.00700040
## 3 -0.084210527 -0.09203007 -0.12571431 -0.142255656 -0.15428572
## 4 0.003237434 -0.02446035 0.01582736 0.045683491 0.04064752
## 5 0.050787403 0.04251966 0.03346458 0.036220474 -0.01929134
## 6 0.042670077 0.04140259 0.01394172 0.008027062 0.01858894
## V12 V13 V14
## 1 -0.001673962 0.005356512 0.0304653198
## 2 -0.004184611 -0.023758348 -0.0006892546
## 3 -0.141052650 -0.151579008 -0.1476691825
## 4 0.035971234 0.023741035 0.0406475222
## 5 -0.085433105 -0.094094495 -0.1220472728
## 6 0.040135210 0.048584682 0.0468948383Transform the data to a long dataset with one column as the period and the other as the return so that we can plot the data easily.
keycol <- "period"
valuecol <- "returns"
gathercols <- paste("V", seq(1:win), sep="")
period.data <- gather_(adjs, keycol, valuecol, gathercols)
period.data$period <- gsub("V", "", period.data$period)
period.data$period <- as.numeric(period.data$period)
Plot the cumulative returns after all the events:
ggplot(period.data, aes(period, returns)) +
  geom_point(alpha=0.1) +
  geom_smooth() +
  geom_hline(yintercept=0, colour="red") +
  ggtitle("MSFT Cumulative Returns for 20/50 SMA Crossover") +
  labs(x="Period", y="Returns")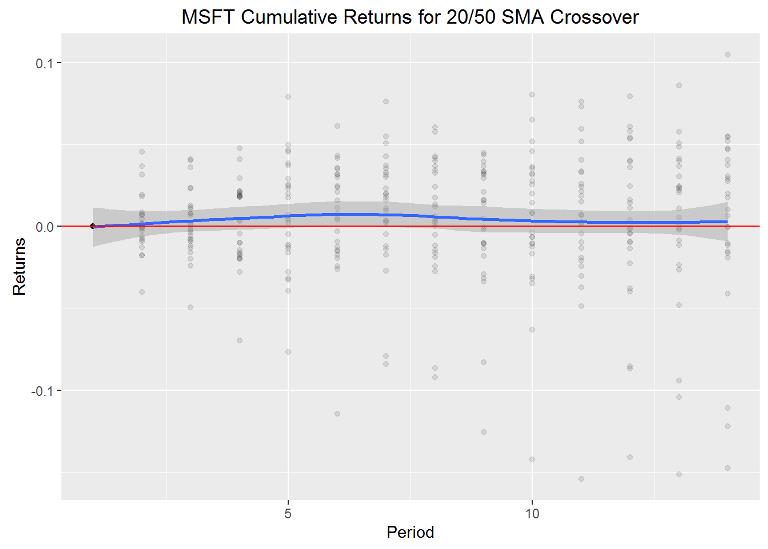
Conclusion
The plot tends to suggest that the stock price peaks 6 or 7 days after the event with the loess smoothing, but this is just the tip of the iceberg. We could, and will, do much more with analyzing stock’s technical events, such as how do they behave as an sector (combine the returns from the events of all stocks in the sector, a follow up post), predicting/forecasting based on events and other data, etc…
Of course, you can tune the parameters (window, slow SMA, fast SMA) to increase returns and for different stocks.
Justin Nafe June 23rd, 2016
Posted In: Exploratory Analysis
Tags: r, stocks, technical events