Insights into data
Next Word Exploratory Analysis
Introduction
For this exploratory analysis, we will parse the en_US.blogs.txt text document, analyze the frequencies of different N-grams, and state how we will accomplish the goals of the Data Science Capstone project.
The data that we will use for this analysis can be found at heliohost.org, and was made available through the John Hopkins Data Science Capstone project.
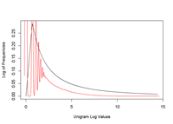
Parse Text
The system will read the text and create a unigram, bigram, and trigram for our analysis. In the process of reading the text, the text is cleaned (remove punctuation except for the single quote, make all characters lowercase, remove unknown characters, remove numbers, and remove profanity).
Pseudo mapper and reducer functions are used to parse the cleaned data in case the resources on the computer are limited. The mapper simply creates the N-gram and the reducer sorts and computes the frequencies.
Justin Nafe July 20th, 2015
Posted In: Exploratory Analysis
Consumption Linear Regression Example
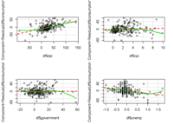
This example uses the USMacroG data provided with R to calculate consumption from changes within other variables.
Let us predict changes in consumption (real consumption expenditures) from changes in other variables such as dpi (real disposable personal income), cpi (consumer price index), and government (real government expenditures).
Justin Nafe January 17th, 2015
Posted In: Machine Learning
Tags: r